Vile Atheist
Loud and Obnoxious
And about time, too! I will never understand why he stuck his nose into things. Talk about un-necessarily politicizing an issue!
Money, quite simply.
Welcome to Religious Forums, a friendly forum to discuss all religions in a friendly surrounding.
Your voice is missing! You will need to register to get access to the following site features:We hope to see you as a part of our community soon!
And about time, too! I will never understand why he stuck his nose into things. Talk about un-necessarily politicizing an issue!
Psst, btw, Oberon, I ignore almost everything you write. I established that you're a fist class bull****ter on about page two. Now I'm just batting at you for fun like a kitten with a ball of yarn.
Again, this has nothing to do with the validity of research against time. It has to do with the claim that disagreement with the IPCC's position in 2003 is meaningful in current context.Wikipedia lists several surveys (I dont feel that information from the wiki needs to be cited) showing a consensus, one of which is the end of last year.You are missing the point. The latest IPCC reports use research conducted prior to 2003. 2003 is hardly out of date, even in the world of climate studies. The most current studies cite articles, books, papers, etc, prior to 2003.
Stop trying to draw false equivalencies. The "bias" of the IPCC shown by you is tenuous at best. The conflict of interest that comes from being funded by an oil lobby should be obvious to the clinically retarded.What I am saying it that there is a clear bias in the upper echelons of the IPCC, which creates problems for trusting it.
And you still dont understand that mostly is an extremely subjective word? Here are the 3 very common usages of it.No, it wasn't. The only debate in climate science with any relevancy to the survey question (the one under discussion) is whether humans are the ones mostly responsible for the current warming trend.
Again, this has nothing to do with the validity of research against time. It has to do with the claim that disagreement with the IPCC's position in 2003 is meaningful in current context.
Wikipedia lists several surveys (I dont feel that information from the wiki needs to be cited) showing a consensus, one of which is the end of last year.
Also, the survey was poorly phrased as "mainly" could be interpreted to be a plurality, majority, or supermajority so its not a very good survey to cite.
Only they didn't. See aboveCalling your survey out of date is the only rational option considering a site like wikipedia has listed several contradictory surveys from peer reviewed sources
the latest one is from 2009
I dont really feel the need to cite this because it takes literally 5 seconds to search "climate change consensus" on wikipedia and click to the surveys.
Stop trying to draw false equivalencies. The "bias" of the IPCC shown by you is tenuous at best. The conflict of interest that comes from being funded by an oil lobby should be obvious to the clinically retarded.
The question was not framed as "do humans contribute more or less to climate change than natural processes" which has no room for interpretation. It was a poor survey.
Here is Bürgers graph of the many regression methods:Burger 2005 said:The MBH98 choice of calculating the PCs of some proxy clusters from anomalies of the 20th century climate has been criticized for reducing off-calibration amplitudes and favoring hockey stick shaped results [cf. McIntyre and McKitrick, 2005a, 2005b]. Under the CNT criterion those PCs are determined from the full period to temper the impact of a strong positive 20th-century trend. We applied Preisendorfers rule N for selecting the PCs. Note that each single criterion is a priori sound, with numerous applications elsewhere, and can hardly be dismissed purely on theoretical grounds. Note further that all of the above criteria are independent, mutually consistent and can thus arbitrarily be mixed, so that any combination thereof defines one of 2^6 = 64 reasonable flavors of the regression model.


NAS 2006 (emphasis added) said:After considering all of the available evidence, including the curves shown in Figure S-1 the committee has reached the following conclusions:
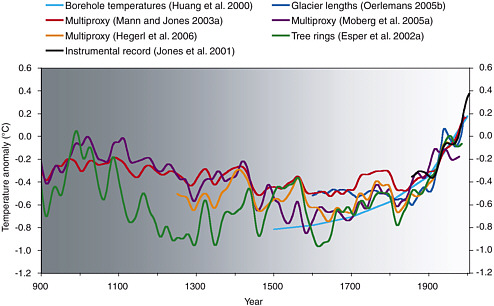
The instrumentally measured warming of about 0.6°C during the 20th century is also reflected in borehole temperature measurements, the retreat of glaciers, and other observational evidence, and can be simulated with climate models.
Large-scale surface temperature reconstructions yield a generally consistent picture of temperature trends during the preceding millennium, including relatively warm conditions centered around A.D. 1000 (identified by some as the Medieval Warm Period) and a relatively cold period (or Little Ice Age) centered around 1700. The existence of a Little Ice Age from roughly 1500 to 1850 is supported by a wide variety of evidence including ice cores, tree rings, borehole temperatures, glacier length records, and historical documents. Evidence for regional warmth during medieval times can be found in a diverse but more limited set of records including ice cores, tree rings, marine sediments, and historical sources from Europe and Asia, but the exact timing and duration of warm periods may have varied from region to region, and the magnitude and geographic extent of the warmth are uncertain.
It can be said with a high level of confidence that global mean surface temperature was higher during the last few decades of the 20th century than during any comparable period during the preceding four centuries. This statement is justified by the consistency of the evidence from a wide variety of geographically diverse proxies.
Less confidence can be placed in large-scale surface temperature reconstructions for the period from A.D. 900 to 1600. Presently available proxy evidence indicates that temperatures at many, but not all, individual locations were higher during the past 25 years than during any period of comparable length since A.D. 900. The uncertainties associated with reconstructing hemispheric mean or global mean temperatures from these data increase substantially backward in time through this period and are not yet fully quantified.
Very little confidence can be assigned to statements concerning the hemispheric mean or global mean surface temperature prior to about A.D. 900 because of sparse data coverage and because the uncertainties associated with proxy data and the methods used to analyze and combine them are larger than during more recent time periods.
The graph referred to as Fig 6.10 is as follows:The uncertainty associated with present palaeoclimate estimates of NH mean temperatures is significant, especially for the period prior to 1600 when data are scarce (Mann et al., 1999; Briffa and Osborn, 2002; Cook et al., 2004a). However, Figure 6.10 shows that the warmest period prior to the 20th century very likely occurred between 950 and 1100, but temperatures were probably between 0.1°C and 0.2°C below the 1961 to 1990 mean and significantly below the level shown by instrumental data after 1980.

So you used the fact that a graph, which wasnt submitted for peer review until November 2007, was not present in a report, published in Feb 2007 eight months earlier, to back Wegman? Please tell you can see the problem here.Oberon said:I used that fact to back the Wegman review.
I have been reading up on global warming a little, because I really know nothing about the issues and controversies surrounding it. What I learned is that during the Middle Ages, there was a period of global warming. My question is that if there was global warming before the industrial revolution, why are scientists so sure that global warming is being caused my man-made pollution rather than natural occurrences?
Global warming affects Philippines so much. In our summer season, typhoons enter the country, extreme drought destroys our crops and hail storms occur in some parts of our country knowing that Philippines is a tropical country.
Might it have something to do with the fact he took into account those criticisms and showed that the same results holds?
Im genuinely trying to understand why you seem determined to attack his earlier work here rather than his later work.
Wegman was not peer reviewed stop dancing around the issue.
Lets have a lookie at the rest shall we? Bürger 2005 (Multiproxy Climate Reconstructions) had nothing whatsoever to do with Wegman.
So later research backs Wegman huh?
Storch et al 2004 was taken into account by NAS 2006. I have already responded to McIntyre and McKitrick. Hell check out Bürger 2007 (On the verification of climate reconstructions) if you really want the gory details of the statistics used. As I have reiterated multiple times now, the criticisms of the statistics, particularly those highlighted by NAS 2006, were incorporated into Manns 2007 work.
I thought you didnt agree with IPCC work?
So you used the fact that a graph, which wasnt submitted for peer review until November 2007, was not present in a report, published in Feb 2007 eight months earlier, to back Wegman? Please tell you can see the problem here.
Time for to start dancing again. And I would appreciate it if you read the sources you are citing since some of them dont support you as shown above.
Really? You sure you arent lying or being somewhat dishonest here? 2005 was the warmest year on recordOf course, the graphs all end at 2000, because global average temperatures did not go up from 1998 to 2005.
I never once cited Manns earlier work. And I still cant understand why the **** you seem intent on attacking despite the fact [SIZE=+2]I never once cited it[/SIZE].1. Wegman's work, while not peer-reviewed, completely demolished Mann's hockey-stick graph.
How??? Do you even read my posts???? And, you seem to be forgetting this, [SIZE=+2]I never once cited Manns earlier work[/SIZE].2. Subsequent studies all bore this out.
Good to see that you opinion has changed from the rubbish you were throwing out earlier in the thread:3. Most reconstructions today agree that the MWP was close to modern temperatures.
Given that current global temperatures are still on the up, you dont see the problem here? Of course you dont. But never let that stop you throwing a horde of irrelevancies out hoping to swamp what the actual research is.THE WORLD WAS WARMER CENTURIES AGO!!!!
Only if you completely ignore all the research exploring the role of humans in the problem. Which you do seem to be intent on doing.4. Even if the MWP did not surpass the temp. at the end of the 20th century, the fact that it came so close prior to mass emissions of "greenhouse gasses" says something about how much of the current warming is anthropogenic.
Fascinating. How can someone who claims to be representative of current science be so willing to quote from the old stuff?<old studies that have been replaced with more up to date research snipped>
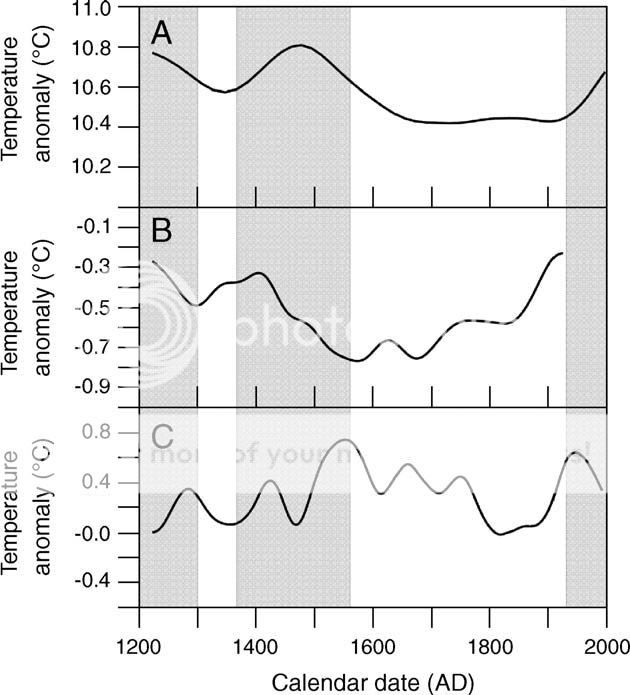
DArrigo said:Taken at face value, our reconstruction indicates that MWP conditions were nearly 0.7 C cooler than those of the late twentieth century. These results suggest how extreme recent warming has been relative to the natural fluctuations of the past millennium.
<portion snipped discusses the difficulties in this method>

Fascinating. How can someone who claims to be representative of current science be so willing to quote from the old stuff?
That's a dumb route to go about it. The trick is to do genuine research and make a name for yourself then promptly sell out any sense of academic honesty.My theory is that he's refining his technique in the hope that he can enter the incredibly lucrative field of pumping out pro-corporate pseudo-academic disinformation when he leaves school.
That's a dumb route to go about it. The trick is to do genuine research and make a name for yourself then promptly sell out any sense of academic honesty.
So I cite Mann’s later work, which incorporated the criticisms of his earlier work (and I reiterated that multiple times), and yet you still go out of your way to discredit that earlier work?
And Wegman wasn’t peer reviewed. But you still dance.
Really? You sure you aren’t lying or being somewhat dishonest here? 2005 was the warmest year on record
Good to see that you opinion has changed from the rubbish you were throwing out earlier in the thread:
Given that current global temperatures are still on the up, you don’t see the problem here?
Time for you dance some more.
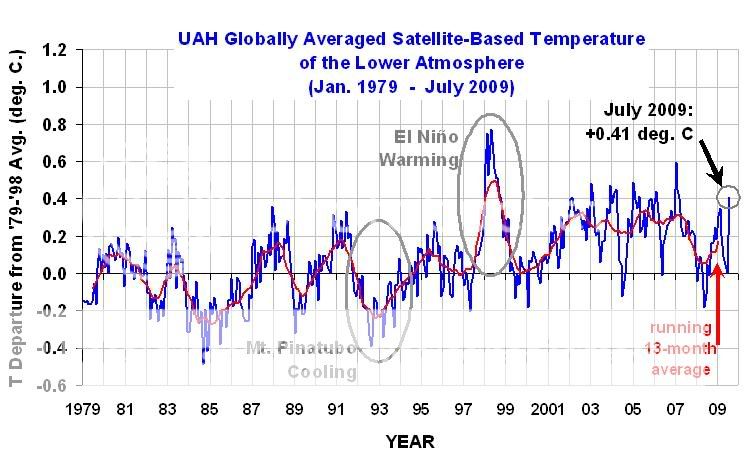
Wow, now Oberon is referencing his own photobucket album as an authoritative source of climate data. Amazing!
That's the only way I know how to post images. However, global temp. data from satellites can be found online from various places (the second graph of global temps, for example, lists the sources inside the picture). Feel free to check my data. As for the other graph of reconstructed tempuratures showing the MWP as warmer than today, it is from the journal article I referenced below, and can be found there.
Finally, the graphs are the least of my points. The citations say far more.